Operating Leverage in Gold Miners: Why Earnings Move More Than Gold
A miner's margin is gold price minus cost per ounce. Because costs lag the price, a 10% move in gold can mean a 30% move in margin, both ways.
Key takeaways
- A miner's margin is gold price minus cost per ounce, so a 10% gold move can mean a 30% margin move in either direction.
- Higher-cost mines have more operating leverage: their margins rise and fall by a larger percentage for the same gold price change.
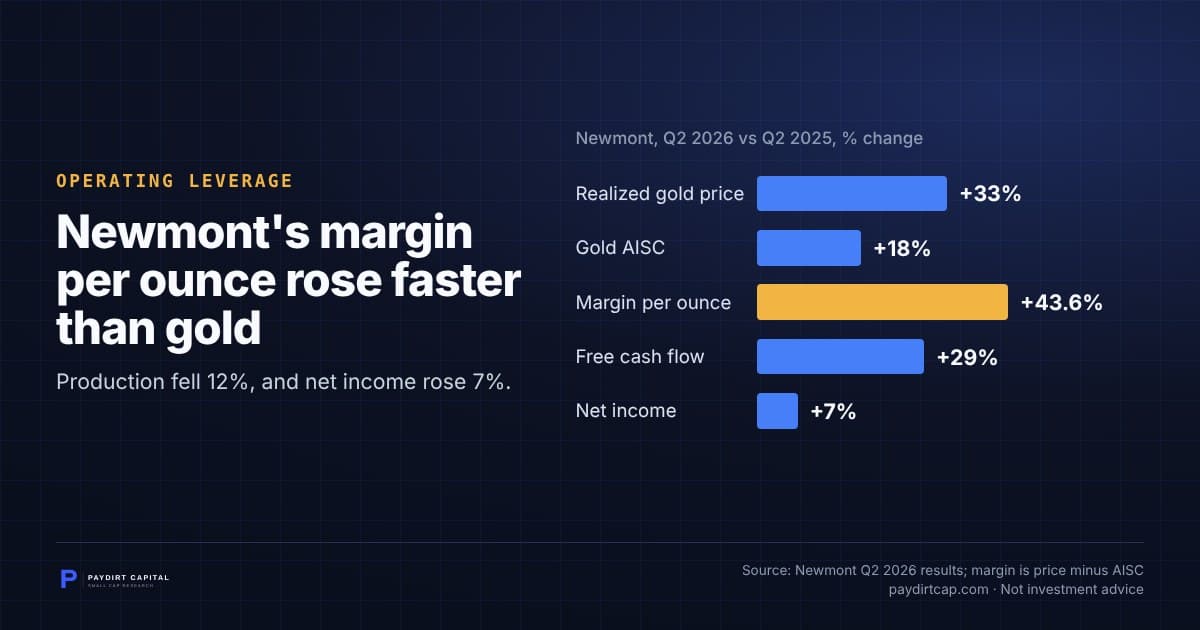
- Newmont's Q2 2026 realized price rose 33% year on year while its margin per ounce rose about 44%, though net income rose 7%.
A gold miner's profit per ounce is the gold price minus what it costs to produce that ounce. Most of that cost does not move with the gold price, so a given percentage change in gold becomes a bigger percentage change in margin. That is operating leverage, and it works in both directions.
Start with margin, not price
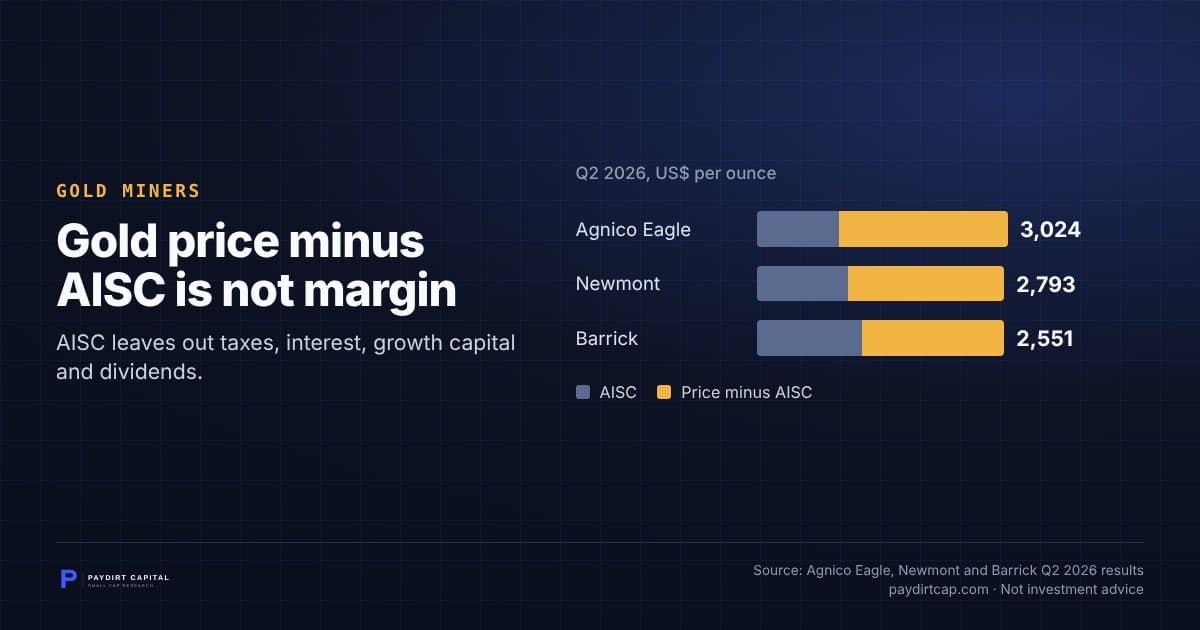
The standard cost measure for gold miners is all-in sustaining cost, or AISC. The World Gold Council says AISC "aims to better reflect the full cost of keeping the mine in business," covering mining and processing plus the sustaining capital, overhead and royalties needed to keep producing. Our full explainer is in all-in sustaining costs explained.
The margin that matters is:
AISC margin per ounce = gold price minus AISC
Costs such as labour, equipment, power and sustaining capital are set by the size and nature of the mine, not the gold price. When the gold price rises and costs hold roughly steady, all of the increase drops into margin.
The math: a hypothetical mine
Everything in this section is a hypothetical illustration. "Mine A" is not a real company or asset, and the prices are round numbers chosen for arithmetic, not a view on gold.
Mine A has an AISC of $2,000 an ounce and sells gold at $3,000. Its margin is $1,000 an ounce.
| Scenario (hypothetical) | Gold price | AISC | Margin per ounce | Change in margin |
|---|---|---|---|---|
| Base case | $3,000 | $2,000 | $1,000 | n/a |
| Gold up 10% | $3,300 | $2,000 | $1,300 | +30% |
| Gold down 10% | $2,700 | $2,000 | $700 | -30% |
A 10% move in gold produced a 30% move in margin. The multiplier is gold price divided by margin: $3,000 divided by $1,000 equals 3.
The multiplier depends on where a mine sits on the cost curve. Using the same $3,000 gold price and a 10% rise:
- Low-cost mine, AISC $1,000: margin goes from $2,000 to $2,300, up 15%. Multiplier 1.5.
- Mine A, AISC $2,000: margin goes from $1,000 to $1,300, up 30%. Multiplier 3.
- High-cost mine, AISC $2,500: margin goes from $500 to $800, up 60%. Multiplier 6.
The high-cost mine gains most in percentage terms when gold rises. It also loses most when gold falls: a 10% drop takes its margin from $500 to $200, down 60%. A further drop below $2,500 makes the margin negative.
Costs do move, just less
Costs are not fully fixed. Royalties and production taxes are often a percentage of revenue, so they rise with the gold price. Newmont's second quarter 2026 release says every $100 an ounce change in the gold price changes its royalties and production taxes by about $6 an ounce.
Apply that to hypothetical Mine A. Gold rises $300, so costs rise about $18. Margin becomes $1,282 instead of $1,300, up 28.2% instead of 30%. The leverage shrinks slightly but remains.
Industry data show the same pattern at larger scale. The World Gold Council reports average AISC of US$1,785 an ounce in Q1 2026, up 16% year on year, while the average AISC margin rose 134% to US$3,076. Royalties rose 85% year on year and doubled their share of AISC from 6% in Q1 2021 to 12% in Q1 2026. The WGC also notes several African countries have adopted sliding-scale royalties that reach 12% when gold is above US$4,500 an ounce. Energy moved too: US diesel prices rose 54% quarter on quarter.
A real-world check: Newmont, Q2 2026 versus Q2 2025
Newmont's reported figures show both the leverage and its limits.
| Metric | Q2 2025 | Q2 2026 | Change |
|---|---|---|---|
| Average realized gold price | $3,320/oz | $4,414/oz | +33% |
| Gold AISC (by-product) | $1,375/oz | $1,621/oz | +18% |
| Margin per ounce (price minus AISC) | $1,945/oz | $2,793/oz | +43.6% |
| Attributable gold production | 1,478 koz | 1,293 koz | -12% |
| Free cash flow | $1,710M | $2,205M | +29% |
| Net income attributable to Newmont | $2,061M | $2,202M | +7% |
The margin line is our calculation from Newmont's reported price and AISC. Even with costs up 18%, margin per ounce rose faster than the gold price. Company totals rose less, because production fell 12%. Multiply margin by attributable ounces and the rough total goes from about $2.87 billion to about $3.61 billion, up about 26%. That product is our approximation, not a company metric. Net income rose 7%, reflecting items below the AISC line such as taxes, depreciation and one-time items.
The lesson: operating leverage acts on margin per ounce. Volume, taxes and accounting sit between that margin and reported earnings.
What dampens or amplifies it
- Price-linked costs: royalties and production taxes reduce the leverage.
- Cost inflation: energy, labour and consumables can rise whatever the gold price does.
- Hedging: a miner that has sold future production at a fixed price gives up some of the upside and some of the downside.
- Production changes: lower volume can offset a higher margin, as the Newmont figures show.
- Currency: costs paid in Canadian or Australian dollars against gold sold in US dollars add another variable, covered in gold priced in Canadian dollars.
Share prices are a separate matter. They reflect expectations about future margins, reserves and capital spending, so they do not track quarterly margin one for one.
What to watch
- Quarterly results: realized gold price and AISC per ounce, reported side by side by most large producers.
- Annual guidance: Newmont's 2026 guidance is by-product AISC of $1,680 an ounce, plus or minus 5%, and many producers publish price sensitivities.
- World Gold Council quarterly AISC data, built from the Metals Focus Gold Mine Cost Service.
- Royalty and tax changes in mining jurisdictions, which change how much of a price rise reaches the miner.
Sources
- World Gold Council: AISC gold cost curve data
- World Gold Council: Record gold prices outpace rising mining costs in Q1'26
- Newmont Q2 2026 earnings release (SEC filing)
- Newmont: Newmont Reports Robust Second Quarter 2026 Results
Frequently asked questions
What is operating leverage in gold mining?
Operating leverage is the tendency of a miner's margin to move by a larger percentage than the gold price, because most costs do not change with the price. In a hypothetical mine with a $2,000 cost and $3,000 gold, a 10% rise in gold lifts the $1,000 margin by 30%. A 10% fall cuts it by 30%.
Why do gold mining stocks move more than gold?
A miner's profit is the gold price minus its all-in sustaining cost. When gold rises and costs stay roughly flat, the whole increase goes to margin, so margin rises faster than gold in percentage terms, and falls faster when gold drops. Share prices also reflect expectations about reserves, costs and future production.
How do royalties affect gold miner margins?
Royalties and production taxes are often a share of revenue, so they rise with the gold price and reduce operating leverage. Newmont says each $100 an ounce change in gold changes these costs by about $6 an ounce. The World Gold Council reports royalties doubled from 6% to 12% of industry AISC between Q1 2021 and Q1 2026.
Related reading
Disclaimer
This content is published by Paydirt Capital, a brand of Apollo Shareholder Relations, for informational purposes only. It is not investment advice, a recommendation, or an offer or solicitation to buy or sell any security. Nothing here should be relied on for investment decisions. Readers should conduct their own due diligence and consult a registered investment advisor before making any investment.
Apollo Shareholder Relations provides paid investor relations, marketing, and communications services to publicly traded companies and may be compensated in cash or securities by companies in the sectors discussed. Where a company mentioned in this content is or becomes a client, Apollo may hold a financial interest in that company and its securities. This content is not independent research.
All facts and figures are drawn from public sources believed to be reliable, but accuracy is not guaranteed. Any forward-looking statements reflect current expectations only and actual outcomes may differ materially. Paydirt Capital and Apollo Shareholder Relations accept no liability for any loss arising from the use of this content.
The Weekly Dig
Find more good dirt in your inbox. The latest stories and ideas, free to subscribe.
Free to subscribe. Unsubscribe anytime. Sponsored content is disclosed.